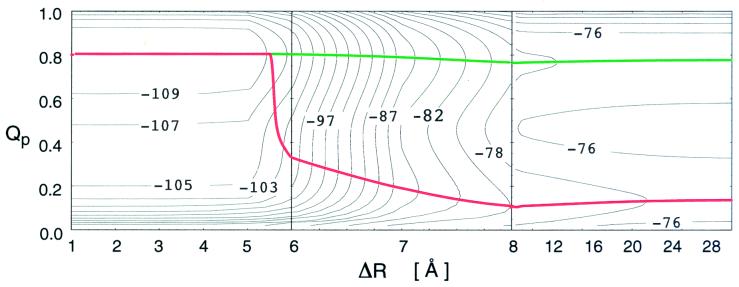
Figure 3.
Contour plots of the two-dimensional free energy surface (in units of kBTf) as a function of approach distance and contact ordering fraction Qp. ΔR = R − R0 is the separation distance relative to that of the bound complex (R0). The steepest descent paths are shown for the unfolded (red) and folded (green) states. At Tf, far from the binding site, the folded and unfolded structures are equally favorable. At ΔR = 20 Å, the unfolded state already feels the interaction falling to a lower contour while the folded state remains unaffected by the binding interaction. Qp for the unfolded ensemble hardly increases until ΔR = 8 Å, whereupon the free energy falls dramatically, while Qp increases by about 0.2. Closer in, the unfolded trajectory completes folding rapidly with binding. Parameters and broken scale in R are same as in Fig. 2.

