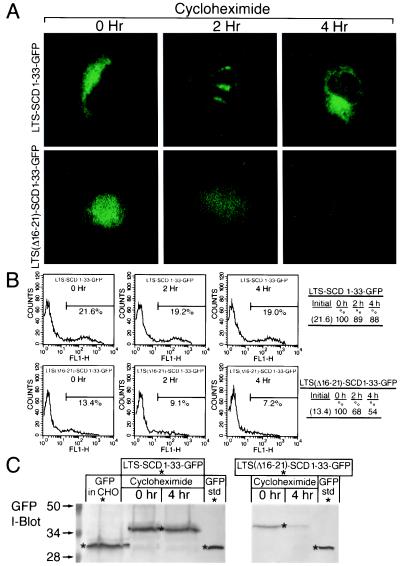
Figure 6.
The degradation signal has specific ER sidedness. The stability of SCD-GFP derivatives fused with the ER LTS. (A) Fluorescence of LTS-SCD 1–33-GFP and LTS(Δ16–21)-SCD 1–33-GFP after cycloheximide treatment. LTS denotes luminal targeting sequence, N-terminal sequence, residues 1–33 of microsomal esterase 3 (10, 12). (B) Flow cytometric analysis of the fluorescence stability of the above constructs. The percentage of cells deemed fluorescent is indicated. The table shows fluorescent cells for each time point as a percentage of initial fluorescence. (C) Immunoblot analysis of the above fusion proteins with monoclonal antibody against GFP.

