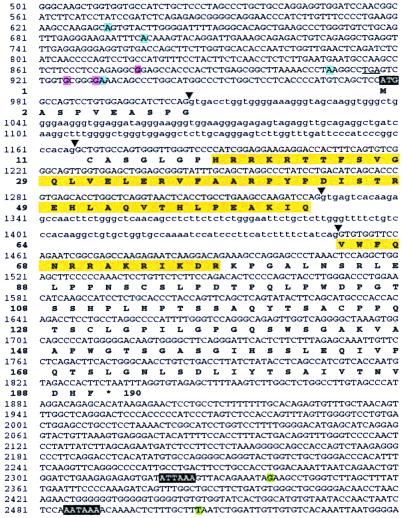
Figure 2.
Nucleotide sequence and structure of the mouse Sebox gene and predicted amino acid sequence of Sebox protein. A portion of the Sebox genomic DNA that was sequenced is shown. Nucleotide residues shown in green represent two polyadenylation sites. Transcription initiation sites found in brain are shown in blue, and ovary in red. The first ATG codon and two polyadenylation signals are shown in white letters on a black background. The homeodomain is shown in yellow. Arrowheads indicate splice sites. Introns are in lower case. An in-frame TGA termination codon upstream of the putative ATG initiation codon is underlined.

