Figure 3.
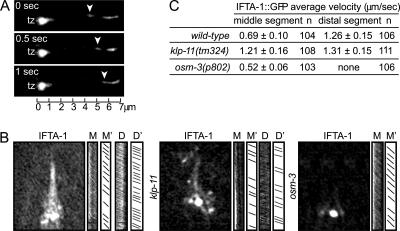
C. elegans IFTA-1 undergoes biphasic IFT. (A) GFP-tagged IFTA-1 undergoes IFT. Shown is a kymograph (3 consecutive 0.5-s time points) depicting the anterograde motility (away from the transition zone, tz) of a GFP-tagged IFTA-1–associated particle (arrowhead) along the ciliary axoneme of one phasmid neuron. Scale bar is shown at the bottom of the kymograph. (B and C) The anterograde IFT motility of IFTA-1 is biphasic. Shown in B are representative “still” fluorescence images and corresponding kymographs (M and D) and kymograph schematics (M′ and D′), obtained from the analysis of IFTA-1::GFP transport (using IFT motility assays) along amphid sensory cilia. Note that the individual diagonal lines of the kymographs correspond to motility rates for individual fluorescent particles. Images (B) and table (C) show that in wild-type cilia, GFP-tagged IFTA-1 displays biphasic IFT, with intermediate velocities along middle segments (M and M′) and fast velocities along distal segments (D and D′). Also shown is the monophasic IFT behavior of IFTA-1::GFP along the ciliary axonemes of animals with loss-of-function mutations in a heterotrimeric kinesin-II subunit gene, klp-11, and a homodimeric OSM-3-kinesin subunit gene, osm-3.

