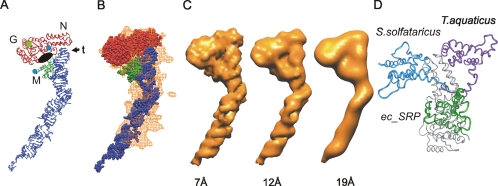
Figure 3.
Comparison of the ec_SRP model with the reconstruction of E. coli SRP. (A) Ribbon diagram representation of ec_SRP (colored as in Figure 2D), highlighting potential regions of interest, including the N, G, and M regions as well as the tetraloop (t) of the SRP RNA. The amino terminus of NG and the carboxyl terminus of M are indicated by blue circles. A black oval indicates the approximate location of the proposed signal sequence binding region of the M domain and the guanine nucleotide binding site of NG is indicated by a green square. (B) Alignment of the ec_SRP model into the reconstruction of E. coli SRP, from Figure 2D. (C) The ec_SRP model was filtered to three different resolutions (left, 7 Å; middle, 12 Å; and right, 19 Å) and displayed at respective threshold values to generate hard surface representations corresponding to ∼90 kDa (see Supplemental Materials for additional views and direct comparison with the reconstruction). (D) The relative orientations of M in ec_SRP (green), SRP54 from S. solfataricus (PDB: 1QZW, blue), and the B/A configuration of T. aquaticus apo-Ffh (adapted from PDB: 2FFH, purple). The slight differences in the respective NG domains are similar to the amount of variation seen in the NG domain from a single organism (T. aquaticus) depending on guanine nucleotide occupancy of the G region. For simplicity, only one of the aligned NG domains is shown (gray). The major difference between the three structures is the relative locations of the M domain. To represent a complete polypeptide backbone for the T. aquaticus structure, an energy minimized 11 amino acid NG-M linker has been modeled. To show the approximate location of the NG-M linker in the Ffh component of ec_SRP residues 298–318 of S. solfataricus SRP54 were positioned between NG and M of ec_SRP.

