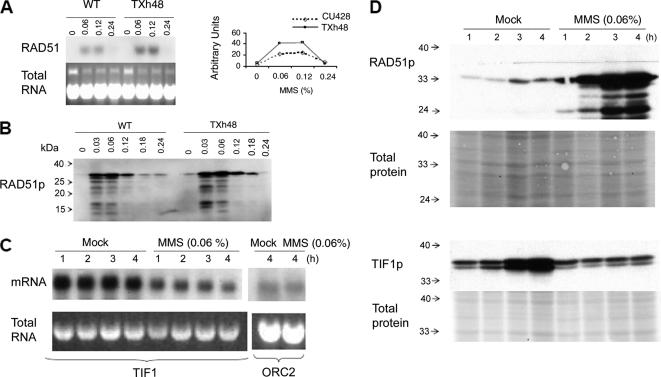
Figure 3.
Regulation of RAD51 and TIF1 by MMS. (A) RAD51 Northern blot analysis after a 1-h exposure to MMS [0–0.24% (vol/vol)]. Top left, hybridization with a RAD51 coding region probe. Bottom left, ethidium bromide staining of total DNA before transfer to GeneScreen Plus membranes (New England Biolabs, Beverly, MA). Right, graphic representation of RNA hybridization signals quantified on a PhosphorImager (Bio-Rad, Hercules, CA). Dotted line, wild type (CU428); solid line, TIF1 knockdown mutant (TXh48). (B) Western blot analysis of Rad51p in wild-type and mutant whole cell lysates (1-h MMS treatment). (C) Northern blot analysis of TIF1 mRNA in MMS-treated wild-type cells. Strain CU427, same MMS treatment regimen as in C. Probes, TIF1 and origin recognition complex, subunit 2 (ORC2) protein-coding regions. Bottom, ethidium bromide staining of RNA preparations for normalization. (D) Rad51p and Tif1p levels in mock and MMS-treated cells (0.06% MMS; 1–4 h). The Tif1p Western blot probe was directed against the myc epitope in the tif1-2–tagged strain TAM101. Membranes were stained with Ponceau S to compare the amount of total protein loaded in each lane.

