Figure 6.
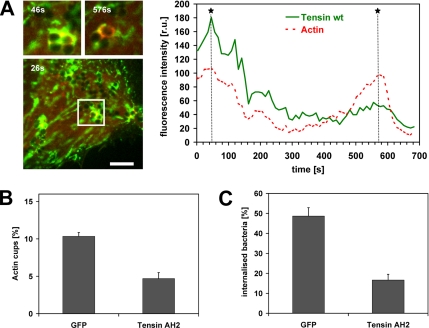
Dynamics of actin and tensin colocalization at phagocytic cups produced by FnBPA-S. carnosus. (A) Dynamic colocalization of actin and tensin at sites of FnBPA-S. carnosus attachment. HUVECs coexpressing GFP-tensin and mRFP-actin were infected with FnBPA-S. carnosus and subjected to live cell imaging. Because GFP-tensin overexpression strongly affects motility of FnBPA-staphylococci (see Figure 3D), we chose a cell with limited GFP-tensin expression and clearly motile cell surface bacteria as determined by probatory imaging. The depicted fluorescence images were taken from Supplemental Movie 8 at the indicated time points. The boxed area in the large fluorescence image contains a bacterial tetrad at which GFP-tensin and mRFP-actin colocalize (evident by yellow areas). This area is shown enlarged at later time points in the two small images on top. Bar, 5 μm. A fluorescence intensity trace of actin and tensin is shown in the right chart. Fluorescence intensities of mRFP-actin and GFP-tensin in a defined area around the bacterial tetrad were plotted as a function of time. Asterisks and dotted lines mark the time points at which the small enlarged fluorescence images were taken. (B) Tensin controls FnBPA-triggered actin cup formation. HUVECs expressing GFP or GFP-tensin AH2 were infected with FnBPA-S. aureus for 1 h. Actin phagocytic cups were visualized by rhodamine phalloidin staining and quantified. Each value represents mean ± SD of a representative experiment in which 100 cells were analyzed. (C) Tensin controls FnBPA-mediated internalization. HUVECs expressing GFP or GFP-tensin AH2 were infected with FnBPA-S. aureus for 1 h, and bacterial internalization was evaluated as described in the legend to Figure 1B. Each value represents mean ± SD of three different experiments with at least 33 cells analyzed per experiment.

