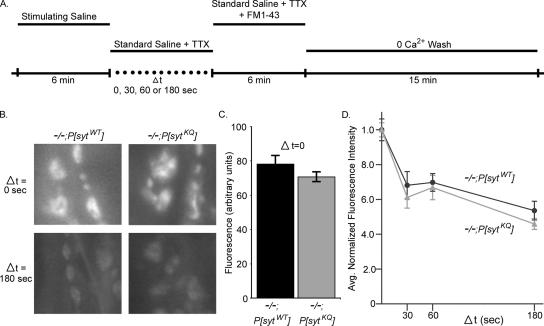
Figure 10.
Rate of endocytosis is not significantly different in synaptotagmin polylysine motif mutants. (A) Schematic of endocytic assay using FM 1-43 dye. (B) Synaptic boutons on muscle 6 and 7 in polylysine motif mutants (−/−;P[sytKQ]) and transgenic controls (−/−;P[sytWT]) were labeled with FM 1-43 dye as described in A. Labeling is shown for Δt = 0 s (top) and Δt = 180 (bottom). (C) At Δt = 0, the average fluorescence intensity of boutons from polylysine motif mutants was ∼10% less than controls. (D) Fluorescence intensity of synaptic boutons is graphed as a function of the time between stimulus termination and application of the FM 1-43 dye (Δt). Polylysine motif mutants: gray triangles, n = 132–135 boutons from nine larvae for each Δt. Transgenic controls: black circles, n = 135 boutons from nine larvae for each Δt. To account for differences between genotypes in the absolute number of synaptic vesicles released during stimulation, fluorescence values for each genotype were normalized to the fluorescence intensity of that genotype at Δt = 0 s. 95% CI = −11.6 to 2.75.

