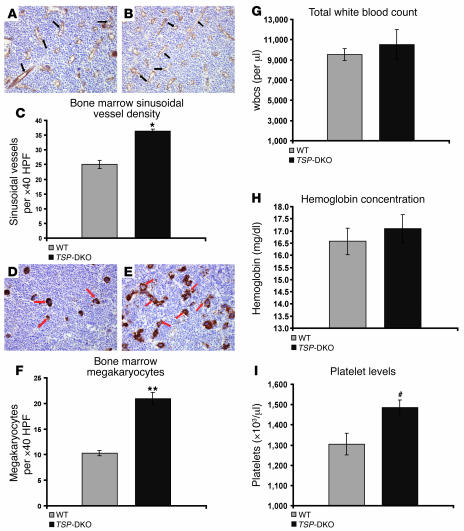
Figure 2. TSP-DKO mice display increased bone marrow microvascular and megakaryocyte density as well as higher peripheral platelet levels compared with WT mice.
(A and B) Marrow sinusoidal microvasculature was quantified in WT (A) and TSP-DKO (B) mice after immunostaining against panendothelial cell antigen clone MECA32. Note that absolute number of cross-sectioned sinusoids (black arrows) is higher in TSP-DKO animals. Representative marrow sections at steady state are shown at original magnification, ×400. DAB was counterstained with hematoxylin. (C) TSP-DKO marrow has a higher sinusoidal microvascular density than WT marrow: 36 ± 0.7 versus 25 ± 1.4 sinusoidal vessels per field. Scored at original magnification, ×400. HPF, high-power field. *P < 0.005. (D) WT marrow, stained for TSPs. Note that only megakaryocytes and platelets are stained. Red arrows indicate differentiated, multinucleated megakaryocytes. Original magnification, ×400. DAB was counterstained with hematoxylin. (E) Megakaryocytes in TSP-DKO marrow are abundant at steady state and can be stained with an antibody against citrullinated proteins. This antibody stained megakaryocytes at the same level of differentiation as the TSP antibody (red arrows). Original magnification, ×400. DAB was counterstained with hematoxylin. (F) TSP-DKO megakaryocyte density is almost twice as high as that in WT marrow: 21 ± 1.2 versus 0 ± 0.5 megakaryocytes per field. Scored at original magnification, ×400. **P < 6 × 10⁻⁶. (G) Leukocyte counts at steady state (n = 6). Difference was not significant. (H) Analysis of hemoglobin concentration (n = 6) showed similar results. (I) TSP-DKO mice displayed significantly elevated platelet counts compared with WT controls: 1,495,000 ± 37,000/μl versus 1,305,000 ± 53,000/μl. #P < 0.05. n = 6.

