
Figure 4.
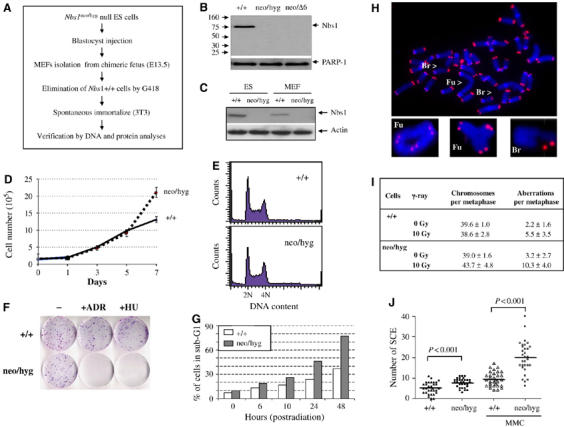
Generation and characterization of mouse ES cells and MEFs carrying constitutive Nbs1 deletion. (A) Protocol used to establish constitutive Nbs1-deleted MEFs from chimeric fetuses. (B) Western blot analysis of Nbs1-null ES cells. PARP-1 is a loading control. (C) Western blot analysis of Nbs1-null ES cells and 3T3 MEFs. Actin serves as a loading control. (D) Proliferation curve of constitutive Nbs1-null MEF cells. Curves represent the mean of triplicate samples from two independent experiments. (E) FACs analysis of cell cycle distribution of Nbs1-null ES cells. (F) Colony formation assay was performed to examine viability of constitutive Nbs1 deleted MEFs after ADR (0.2 μg/ml) or HU (2 mM) treatment. (G) Histogram shows the percentage of ES cells in sub-G1 phase extracted from FACs analysis at the indicated time points after 10 Gy of IR. Representative images of FISH analysis (H) and quantification (I) of wild type (+/+) and Nbs1-null (neo/hyg) ES cells subjected or not to 10 Gy of IR. Br: breaks; Fu: fusions. Between 16 and 19 metaphases from each treatment were analyzed and the results are shown as the mean±standard deviation. (J) SCE analysis of constitutive Nbs1-null MEFs with or without MMC treatment. At least 31 metaphases of each sample were scored and the t-test was applied for statistical analysis.