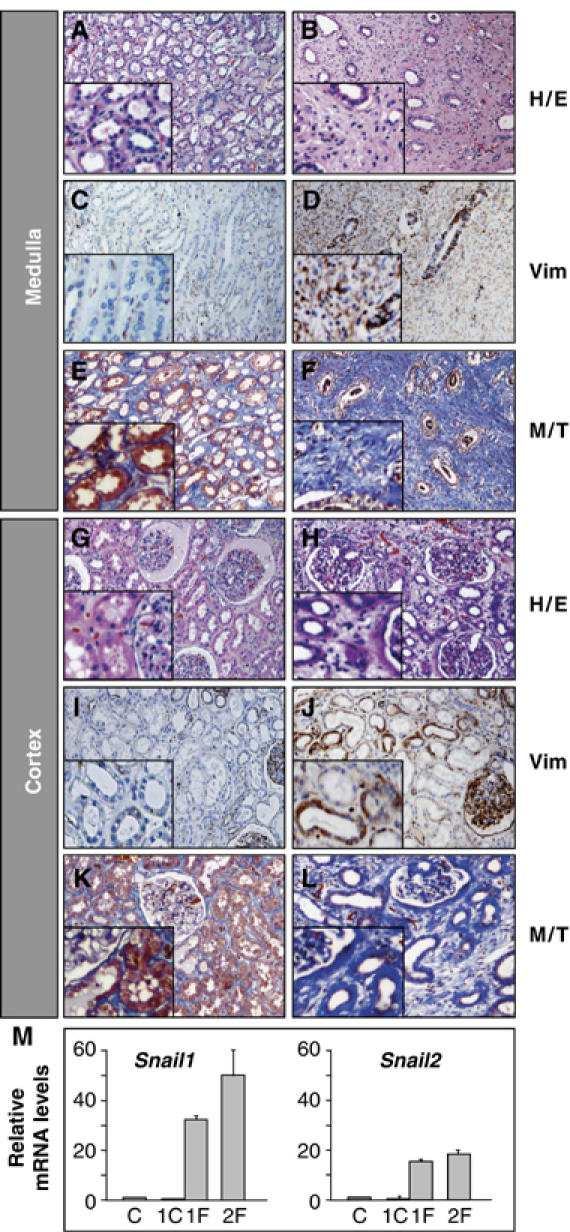
Figure 7.

Fibrotic human kidneys show strong Snail expression. Sections from normal human kidney tissue (A, C, E, G, I, K) and from a patient subjected to nephrectomy due to urinary obstruction and kidney failure (B, D, F, H, J, L) showing hematoxylin/eosin staining (H/E), vimentin expression (Vim) and fibrotic deposits in blue following Masson–Trichome staining (M/T). (M) Quantitative RT–PCR analysis of Snail1 and Snail2 expression in normal human kidney tissue (C, n=4), nonfibrotic (1C) and fibrotic tissue from patient 1 (1F) and patient 2 (2F). Transcript levels are normalized to GAPDH mRNA expression and the error bars represent the standard error of the mean.
