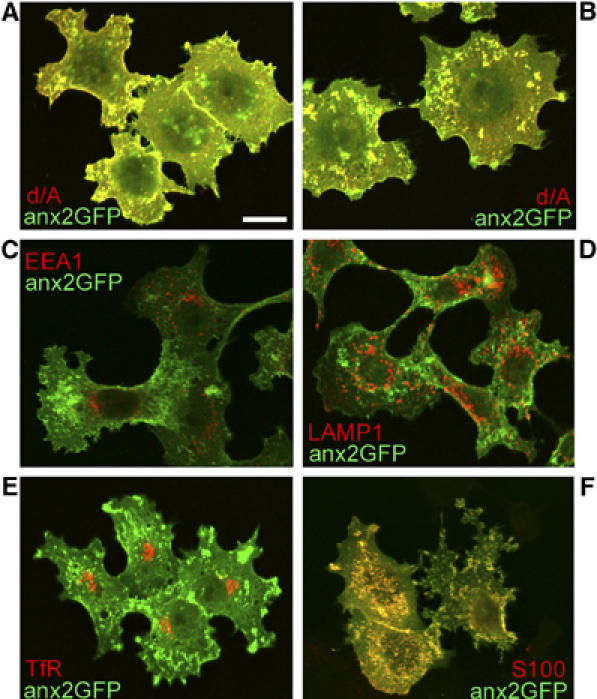
Figure 8.

Distribution of anx2-GFP: comparison with d/A, EEA1, LAMP1, transferrin receptor and S100A10. Notice the large co-localization of anx2-GFP with d/A (A, B) and S100A10 (S100, F), whereas with the markers of early (EEA1, C) and recycling (TfR, E) endosomes, and of lysosomes (LAMP1, D) co-localization is below the level of specificity. The bar in (A), valid also for (B–F), corresponds to 10 μm.
