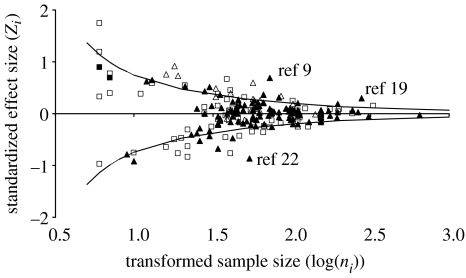
Figure 1.
Bivariate funnel plot of the relationship between sex ratio adjustment and biological (triangles; n=139) or temporal (squares; n=75) traits sensu Ewen et al. (2004). Overlaid significance lines are calculated for α=0.05 following Sutton (1990). Open symbols indicate the three study parameters with common weighted average effect sizes significantly different from zero (male quality a biological trait ZSTAT=2.9, n=17, p<0.005; laying sequence a temporal trait ZSTAT=−4.9, n=32, p<0.001; and season a temporal trait ZSTAT=2.3, n=33, p<0.05). The three marked observations refer to outliers for territory quality (a biological trait) previously identified in Ewen et al. (2004). Reference numbers indicate the original citations (see the electronic supplementary material).

