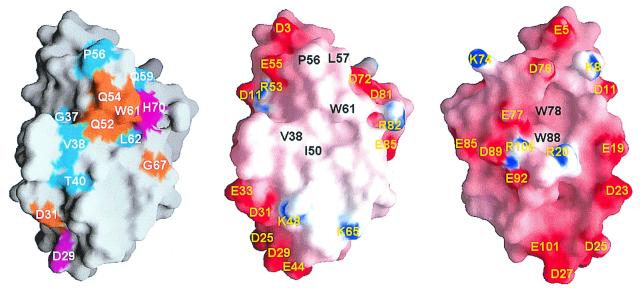
Figure 4.
Surface representation of E. coli CyaY. (Left) Strictly conserved residues (gold), semiconserved residues (cyan), and residues corresponding to disease-associated mutations in frataxin (magenta) are indicated. This view is the same as that in Figs. 2 and 3 Left. (Center) Diagram showing the electrostatic potential at the molecular surface of the β-sheet side of E. coli CyaY in the same orientation as in Left. The surface is color-coded according to the potential: red, −15 kT; white, 0 kT; and blue +15 kT. (Right) A view obtained by a 180° rotation of Center around a vertical axis. This figure was drawn with grasp (25).

