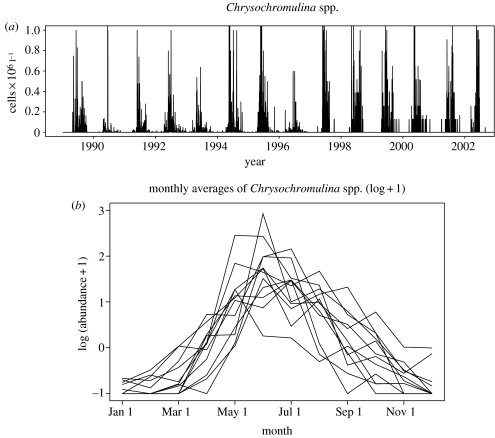
Figure 2.
Chrysochromulina spp. data. (a) The raw data; observations sampled about every second day from the bay of Flødevigen (station 1 in figure 1). (b) Monthly averages of Chrysochromulina spp. data after removing an AR(35) time-series from the raw data (see text).

