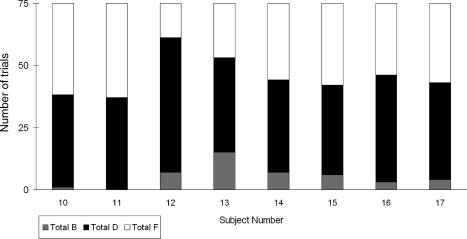
Fig 4. A stacked bar chart representing the proportion of each consequential stimulus presented across the final 75 trials of the generalization test phase by Participants 10–17 in Experiment 3.
The reader should note that it was possible to produce the B and the F stimulus only on a maximum of 50% of the trials.

