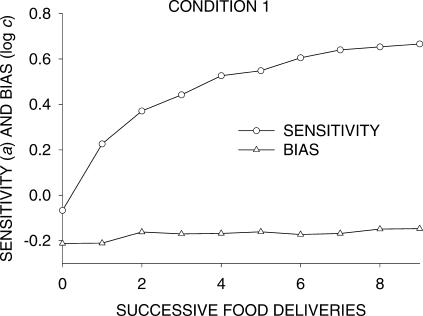
Fig 1. Sensitivity to food ratio and bias (a and log c, respectively, in Equation 1) prior to each successive food delivery in components in Condition 1.
The data used were numbers of responses between food presentations averaged across the 6 pigeons. Data for individual pigeons are shown in Appendix Figure 1.

