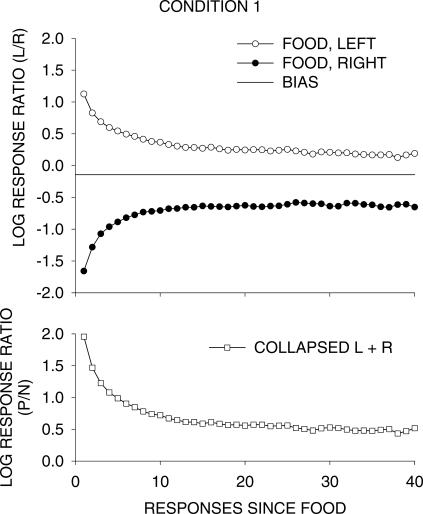
Fig 2. Upper panel: Log left/right-key response ratios for the first 40 responses following left- and right-key food deliveries in Condition 1.
The data were averaged across the 6 pigeons. The horizontal line shows the overall log response ratio in this condition. Lower panel: The same data collapsed and plotted as log response ratios to the alternative that just produced food plus magazine light presentations (log P/N). Results for individual pigeons are shown in Appendix Figure 2.

