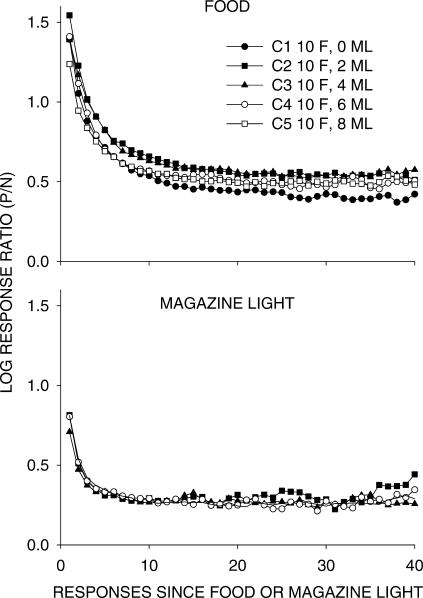
Fig 4. Response ratios to the alternative that just produced food plus magazine light or magazine-light-only presentations (log P/N) for the first 40 responses following left- and right-key events as the proportion of magazine-light-only presentations to total events was increased.
The upper graph shows performance after food plus magazine light presentations; the lower graph shows performance after magazine-light-only presentations. The data were averaged across the 6 pigeons in Conditions 1 to 5. C refers to the experimental condition, F to food plus magazine light presentations, and ML to magazine-light-only presentations.

