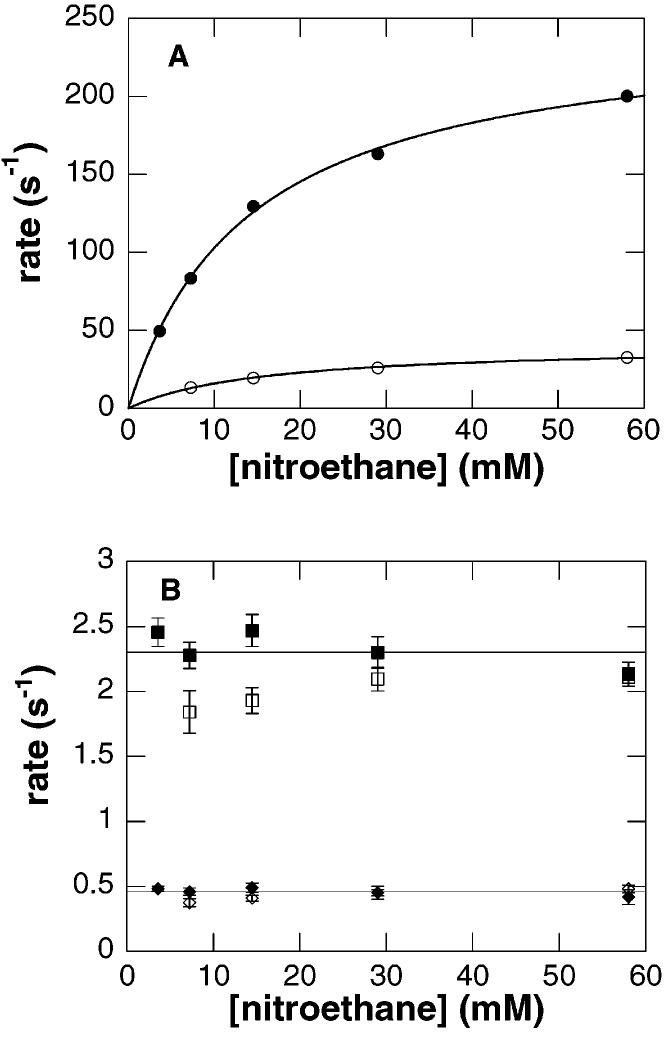
Figure 3.
Concentration dependence of reduction of wild-type nitroalkane oxidase by nitroethane. Conditions as described in the legend of Figure 2. The rates of the fast phase (A) and the two slower phases (B) are plotted vs the concentration of nitroethane (filled symbols) or [1,1-2H2]nitroethane (empty symbols). The lines in panel A are individual fits of the data for each substrate to eq 3; the error in each data point in panel A is smaller than the symbols.

