Figure 3.

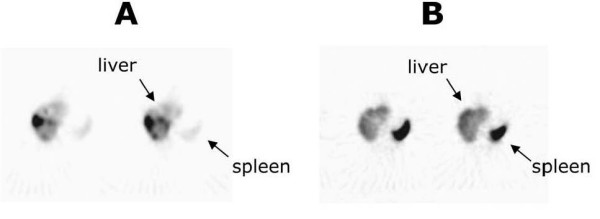
SPET images from patient #1, 6 h after i.a. (A) or i.v. (B) injection of A-NK cells. Greater migratory activity of A-NK cells is observed in the liver after i.a. administration. Two consecutive axis sections are shown.

SPET images from patient #1, 6 h after i.a. (A) or i.v. (B) injection of A-NK cells. Greater migratory activity of A-NK cells is observed in the liver after i.a. administration. Two consecutive axis sections are shown.