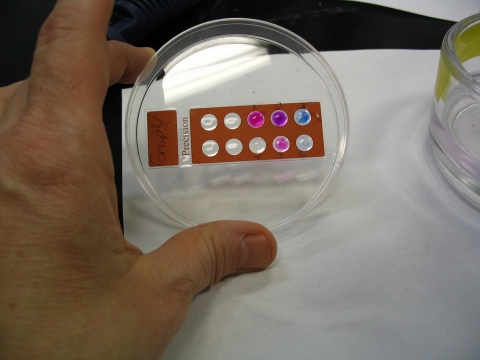
Figure 4.
Results of the microarray simulation carried out by students at Hinsdale Central High School in Hinsdale, IL. The colors in this microarray simulation are red, blue, and purple (red and blue combined) instead of red, green, and yellow seen in a typical DNA microarray. Note differences in color intensities between spots 1 and 5 (both red) and 3 and 6 (both blue). Spot 2 is purple and 4 is colorless. The speckled coloration is due to incomplete mixing after reheating the master solution of spotting solutions.

