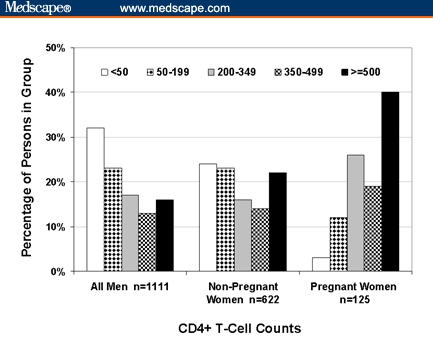
Figure.

Frequency distributions of the first CD4+ T-cell counts of HIV-positive men, pregnant women, and nonpregnant women who had their first CD4+ T-cell counts within 6 months of their first reported positive HIV tests, Southeast Michigan, 1992–2002 (N = 1858). The CD4+ T-cell count categories shown in the legend are in cells/mm3.
