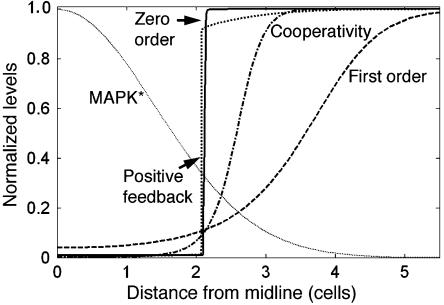
Figure 3.
Different mechanisms could generate a sharp threshold of Yan degradation. Yan steady-state concentration was found by numerical simulations (see Materials and methods for further information). The concentration levels are normalized with the corresponding maximal concentrations. At first order, the graded reduction in active MAPK distribution (thin dotted line) leads to a smooth gradual increase in the level of total Yan concentration (dashed line). In contrast, a clear switch-like behavior is observed for the three other cases, namely the cooperative, linear model (dash/dot line), the feedback model (dotted line) and the zero-order model (solid line).

