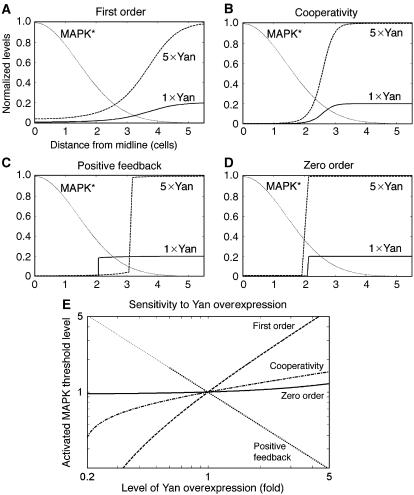
Figure 4.
Computational predictions of the steady-state Yan degradation pattern upon its overexpression. (A-D) The steady-state profiles of Yan for different levels of Yan protein for some reference level (× 1) of Yan production rate and for a five-fold (× 5) increase in this production rate. Yan levels are normalized by the initial level of the overexpressed network. The expected distributions are calculated for the first-order, non-cooperative model (A), first-order, cooperative model (B), first-order model with positive feedback (C) and zero-order model (D). Note that an increase in Yan levels in the linear, non-cooperative case and in the linear positive feedback case significantly alters the threshold positions of Yan degradation. In sharp contrast, threshold positions are insensitive to the level of Yan production in both the first-order, cooperative model and the zero-order model. (E) The critical MAPK value was examined for different levels of Yan overexpression. The critical MAPK value is defined as the level of MAPK activity for which the absolute Yan level reaches a certain threshold. We defined the threshold as 90% of the maximal level of the most underexpressed situation for Yan (chosen here as 0.2 of the endogenous Yan level). All curves are normalized such that the critical MAPK value equals one for the wild type (overexpression of one-fold). As can be seen, the critical MAPK value is highly sensitive to Yan overexpression in the non-cooperative, linear cases, either in the absence (dashed line) or presence of a positive feedback loop (dotted line). For the positive feedback case, the critical MAPK value is shown for overexpression values larger than 0.6, because for lower values the network exhibits an abnormal behavior (Supplementary information). In contrast to the non-cooperative linear models, the cooperative first-order case is considerably less sensitive (dash/dot line). Similarly, the critical MAPK level hardly changes in the zero-order case (solid line). Simulations were obtained by solving equations (1), (2), (3), (4), (5) and (6) numerically. See Materials and methods for the rate constants used.

