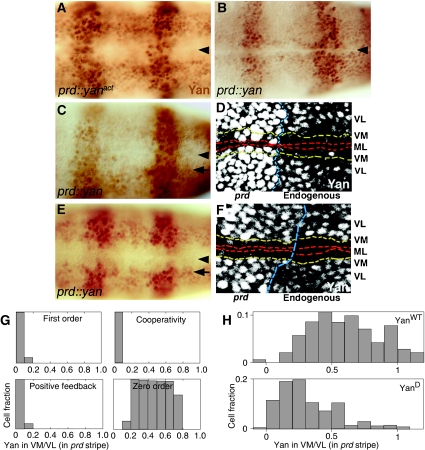
Figure 6.
Experimental validation of zero-order kinetics of Yan degradation. prd-Gal4 was used to drive Yan expression in stripes. (A) Yan construct that cannot undergo phosphorylation is maintained in the prd stripes. A stage 11 embryo is shown. (B-F) Expression of a wt Yan construct. (B) At stage 9, endogenous and ectopic Yan proteins are detected and extend to the ventral midline (arrowhead), as EGFR/MAPK activation has not ensued. (C, D) An intermediate pattern is detected at stage 10 in a significant portion of embryos, where endogenous Yan in the ventral-most rows has already disappeared (arrow), whereas ectopic Yan was unaltered. The midline (ML) is marked by a dashed red line, the border of Yan degradation between the ventral-most (VM) and ventro-lateral (VL) cells by a dashed yellow line and the border of the ectopic prd stripe by a dashed blue line. (E, F) In late stage 10 embryos, ectopic Yan was also degraded in the ventral ectoderm, and the degradation border is aligned with the endogenous one (arrow). The detection of an intermediate step implying longer degradation times for ectopic Yan, as well as the alignment of degradation borders for endogenous and ectopic Yan, validates the zero-order kinetics of Yan degradation. (G) Prediction of the distribution of ectopic Yan intensities within individual nuclei after completion of degradation of endogenous Yan, according to the four models. In the three first-order cases, the rate of degradation of ectopic Yan is elevated, such that endogenous and ectopic Yan are degraded at comparable times. Thus, at the time when endogenous Yan is degraded, most nuclei are predicted to display ectopic Yan levels that are centered on 0-0.1. Conversely, owing to the linear decay of Yan in the zero-order case, ectopic Yan levels are predicted to be broadly distributed between all values. The abscissa corresponds to the ratio between level of Yan in a given nucleus and the average level of ectopic Yan outside the degradation zone. The ordinate is the fraction of cells displaying each of the values. (H) To measure the distribution of ectopic Yan intensities, fluorescent staining in individual nuclei was quantitated. In the embryo shown in panel D, endogenous Yan is degraded in the VM cells (marked by dashed yellow line), whereas ectopic Yan in the same domain is still detectable. The level of Yan in the degradation zone within the prd domain in each nucleus was divided by the mean level of ectopic Yan outside this zone, within the same stripe. Plotting the level of ectopic Yan in the degradation zone in individual nuclei gave a distribution that is consistent with the zero-order model (upper panel). The distribution of values across the entire spectrum is indicative of a linear kinetics of degradation. Plotting the level of ectopic YanD in individual nuclei within the degradation zone shifted the values to the low levels, indicative of rapid degradation (lower panel). Owing to fluctuations between nuclei in the expression levels of ectopic Yan or YanD, some nuclei in the degradation zone gave a value larger than the mean outside the zone and some showed values below the mean for endogenous Yan within the zone. Values above 1.2 and below −0.1 are not shown (15% of the nuclei for Yan and 3% of the nuclei for YanD).

