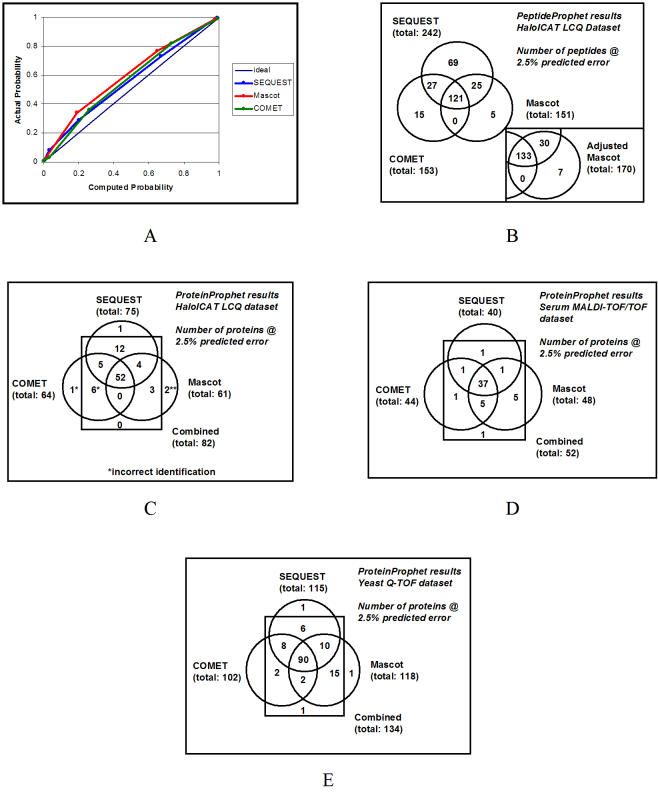
Figure 2.
Trans-Protoemic Pipeline analysis of LC-MS/MS data sets. (A) Accuracy of PeptideProphet-computed peptide probabilities for HaloICAT LCQ data set in sliding window of 50 search results. (B) Numbers of search results for HaloICAT LCQ data set filtered at a minimum PeptideProphet probability to achieve a predicted 2.5% error rate. The inset shows the numbers using Mascot results with probabilities adjusted by SearchCombiner to take into account the results of SEQUEST and COMET applied to the same data set. (C) Numbers of ProteinProphet identifications for HaloICAT LCQ data set filtered at a minimum ProteinProphet probability to achieve a predicted 2.5% error rate. Each asterisk indicates an incorrect protein identification. (D) Numbers of ProteinProphet identifications for Serum MALDI-TOF/TOF data set filtered at a minimum ProteinProphet probability to achieve a predicted 2.5% error rate. (E) Numbers of ProteinProphet identifications for Yeast Q-TOF data set filtered at a minimum ProteinProphet probability to achieve a predicted 2.5% error rate.

