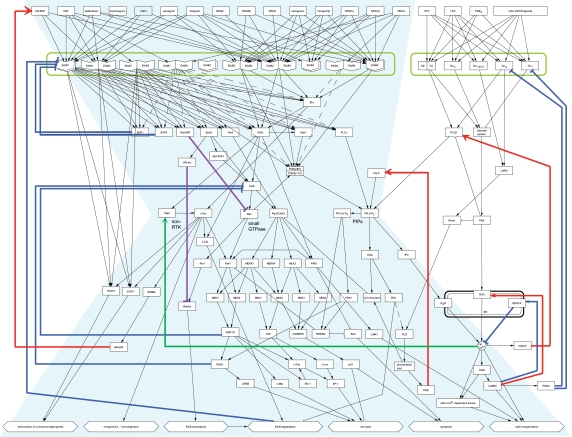
Figure 2.
The bow-tie architecture of the EGFR signaling pathway. A simplified diagram was created based on the EGFR signaling map in Figure 1. Arrows in this figure represent an informal notation of 'flow of reaction'. Various ligands bind to diverse receptor heterodimers, which then converge into a handful of molecules building a conserved core. Activities of these molecules play important roles in controlling diverse responses. Notable interactions are color-coded: red, positive feedback loop; blue, negative feedback loop; purple, inhibitory feed-forward path; green, crosstalk from GPCR cascade to EGFR cascade via calcium release. This image is also available as high resolution PDF (see Supplementary PDF 2) or Scalable Vector Graphic (SVG).

