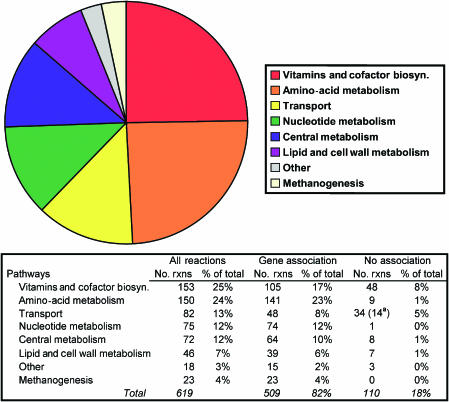
Figure 2.
The distribution of reactions in iAF692. The table gives the pathway distribution for the total, gene-associated and non gene-associated reactions. Non gene-associated reactions were added on the basis of biochemical, physiological or modeling evidence. aDenotes that 14 reactions are diffusion reactions and would not require a gene association.

