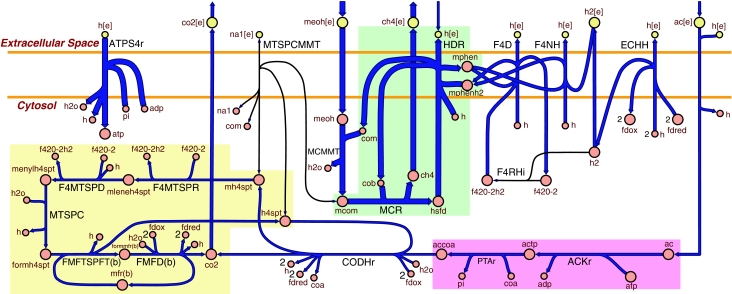
Figure 6.
A flux map of the methanogenic pathway for growth of an mtr mutant on methanol and acetate. Blue arrows indicate the direction of enzymatic activity and the arrow thicknesses are proportional to the flux through each reaction (a thicker arrow has a larger flux). The uptake of acetate (ac) is dependent on the uptake of methanol (meoh), which was constrained at 16 mmol gDW−1 h−1. The MTSPCMMT reaction encoded by the mtr operon is not available to the cell (because of the mutated state) and the F4RHi reaction is predicted not to be active for this optimal growth solution. All of the primary metabolites (large circles) are connected, except for ATP which participates in ATPS4r and ACKr. The secondary metabolites (small circles) that appear more than once in the map are adp, pi, h, h2o, fdred, fdox, f420-2h2, f420-2, coa and com. The different colored regions correspond to the equal flux correlated reaction sets that were determined during the gene deletion analysis and are listed in Figure 5. All the reactions in each set will contain the same flux value for a given condition. The map does not display the stoichiometry for the ion translocating reactions (see Figure 4). The reaction abbreviations are listed in Figure 4 and also in Supplementary information 1 along with the metabolite abbreviations.

