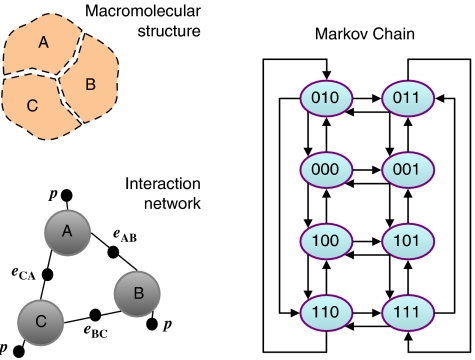
Figure 2.
Interaction networks. The state and properties of the macromolecular structure can be described by an interaction network. Nodes (big gray circles) in the interaction network represent whether or not a component is present. Small black circles are joined to nodes and represent interactions between the elements they join. Labels associated with black circles indicate the contributions to the free energy arising when all the nodes they are linked to are occupied. This graphical representation is equivalent to the mathematical expression of the free energy in terms of binary variables. For the network shown here, the free energy of a state s=(sA,sB,sC) is given by ΔG(s)=p(sA+sB+sC)+eABsAsB+eBCsBsC+eCAsCsA, where p is the positional free energy and eAB, eBC, and eCA are the interaction free energies between the different components. Instantiating all the possible values of the state variable s leads to eight states, which have a Markov Chain (Norris, 1997) graphical representation in which nodes indicate each specific state sAsBsC of the complex and arrows indicate transitions from one state to another. Only transitions in which a component gets in or out of the complex are displayed here.

