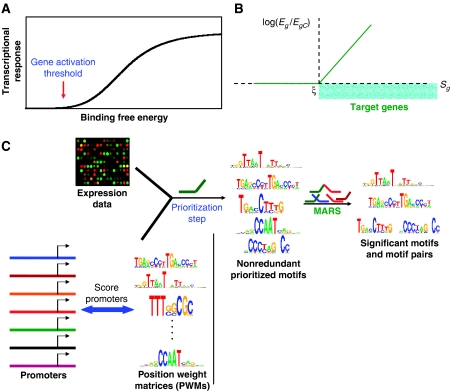
Figure 1.
Modeling mammalian transcription with linear splines. (A) Sigmoidal transcriptional response (Carey, 1998). The response is flat below a binding affinity threshold, namely, the gene activation threshold, and varies exponentially above it. It saturates at high binding energies. (B) Example of a linear spline. A linear spline is a piecewise linear function: it is zero below (above) a threshold, termed knot (ξ), and changes linearly above (below) it. Eg refers to the observed mRNA level of gene g, whereas EgC is its mRNA level in the reference sample. Knots are related to gene activation thresholds. All genes with PWM scores Sg>ξ are predicted targets of the motif contributing to this spline, shaded in blue. (C) A schematic view of the key steps in identification of significant motifs and motif pairs using linear splines.

