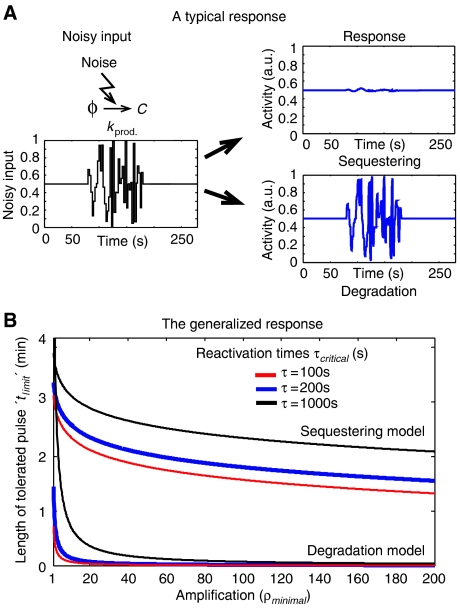
Figure 2.
Noise resistance. (A) A typical response to noise: The two models were exposed to the identical noisy input shown, and their dynamics was followed. We note that the sequestering-based model is much more resistant to noise than the degradation-based model. A frequency–response analysis of this system was also performed, which confirmed these results (see Supplementary information). Parameters used: Degradation model: kprod.=1 M s−1, kdeg.on=0.1 M s−1 and kdeg.on=1 s−1. Sequestering model: kprod.=0.01 M s−1, kdeg.=0.01 s−1, kass.∼0.01 M s−1 and kdiss.∼0.1 M s−1. Both models: mtot.=10, km=1 s−1and k−m=100 s−1. (B) In order to compare the two models, we defined a noise resistance threshold corresponding to the time, ‘tlimit', it takes for either model to reach a fraction of 1−e−1 of the difference between its initial and final value. The larger tlimit, the longer time it takes for the system to reach its final steady-state value. tlimit is thus a measure of how long perturbations the system can handle. In the figure, we see how the critical time varies with the amplification and reactivation time. The fact that the sequestering-based model is able to buffer longer perturbations is clearly seen. Worth noting is also that the vertical location of the sequestering curve depends on the free parameter kdeg., the current value was thus chosen as an example rather than as an absolute value. Parameter used: degradation model — kprod.=1 M s−1, kdeg.on=0.1 M s−1 and kdeg.on=1 s−1; storage model — kprod.=0.01 M s−1, kdeg.=0.05 s−1 and kass.∼0.1 M s−1; both models—mtot.=10, km=1 s−1and k−m=100 s−1.

