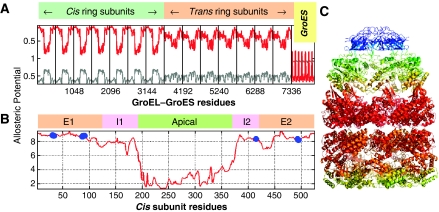
Figure 5.
Regions of high broadcasting ability. (A) Residues acting as hubs lie on the peaks of maximal responsibility curve shown in gray, whereas residues shared by multiple clusters take on the job of messengers. They have high entropy values (red curve). (B) A detailed representation of the entropy curve for subunit D in the cis ring. Blue circles represent residues making at least two atom–atom contacts with the ADPs in the GroEL–GroES(ADP)7 complex. All amino acids in/near the nucleotide-binding pocket are located in this high entropy region. (C) Entropy values as a color-coded ribbon diagram. Code: red–orange–yellow–green–blue, in the order of decreasing entropy. Equatorial domains of the cis ring subunits possess the highest entropy values, whereas the cap residues are distinguished by their low entropies.

