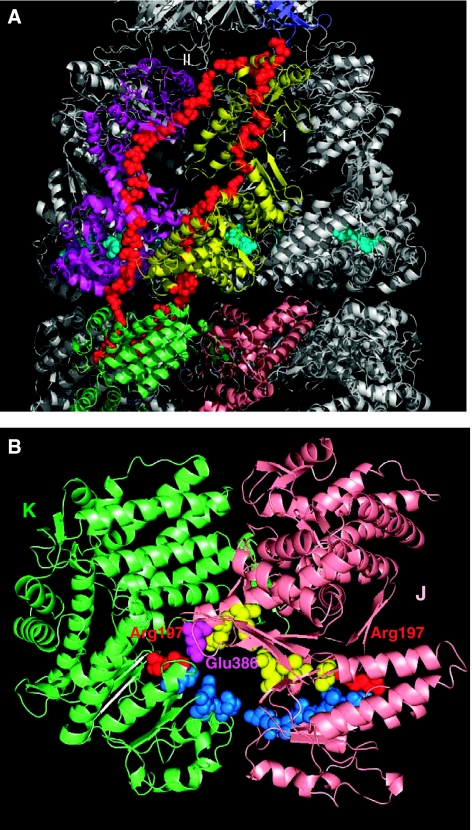
Figure 6.
Inter- and intra-ring communication pathways. (A) Two maximum likelihood pathways (red spheres), labeled I and II, originating from residues Thr90 and Pro33 respectively, on subunit K near the nucleotide-binding site, and ending in residue Gly24 on the GroES mobile loop. The ADP molecule near subunit D is shown in cyan. (B) Maximum likelihood pathway originating from Arg197 (red) on subunit K and ending in Arg197 (red) on subunit J. The pathway is shown in yellow, achieved readily through the salt bridge Arg197–Glu386. Residue Glu386 on subunit J is shown in magenta. Also shown in blue is the pathway computed for the mutant R197A. The latter involves four additional residues in subunit K.

