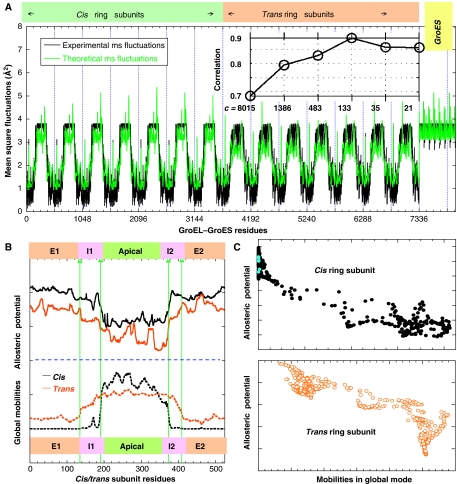
Figure 7.
Collective dynamics and comparison with communication entropies. (A) Comparison of the experimental (black) and theoretical (green) distributions of mean-square fluctuations of residues. The theoretical curve is reconstructed from level 3 of the hierarchy. The inset shows the correlation coefficient between the theoretical B-factors derived from each level of the hierarchy (from full residue representation (c=8015) to the coarsest scale (c=21) and the experiment. Interestingly, the full residue representation (with 8015 residues) yields a correlation coefficient of 0.68 that is lower than coarse-grained representation. In particular, at level 3 (c=133), the correlation coefficient is 0.89. (B) Comparison of the communication potentials (entropies) of residues (upper panel) with their mobilities in the global mode (lower panel) for trans (orange) and cis (black) ring subunits. The communication entropies are computed using equation (5), at level L=4. Mobilities (normalized square displacements) are found from the lowest frequency GNM mode, almost identically reproduced at all levels of the hierarchy. (C) (Anti-)correlation between communication entropies and global mobilities, shown for the cis (top) and trans (bottom) ring subunits. The two sets of data yield respective correlation coefficients of 0.94 and 0.89, revealing a dual role, both mechanical stability and efficient signal propagation for a subset of residues distinguished by their restricted mobility. Also shown in panel C as blue dots are the locations of ATP-binding residues Leu31–Pro33, Asp87–Thr91, Gly415 and Asp495, exhibiting high entropies and low mobilities.

