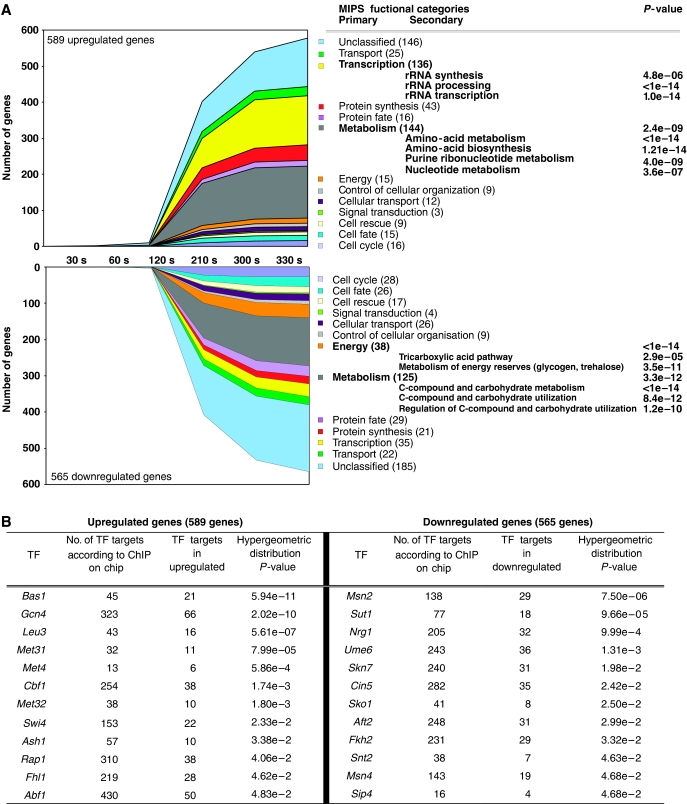
Figure 2.
Interpretation of transcriptome data. (A) The 1154 differentially expressed genes were distributed over MIPS functional categories as a function of time (s). The number mentioned in brackets indicates the total number of genes found in the categories. Overrepresented primary and secondary functional categories according to a hypergeometric distribution analysis with a threshold P-value of 0.01 with Bonferroni correction are mentioned together with their calculated P-values. (B) Transcription factor analysis; the 1154 differentially expressed genes were intersected with transcription factor target genes according to the ChIP on chip analysis (Harbison et al, 2004) and the probability that the representation of each factor occurred by chance was assessed by hypergeometric distribution. The table displays significant factors that returned a P-value lower than 0.05.

