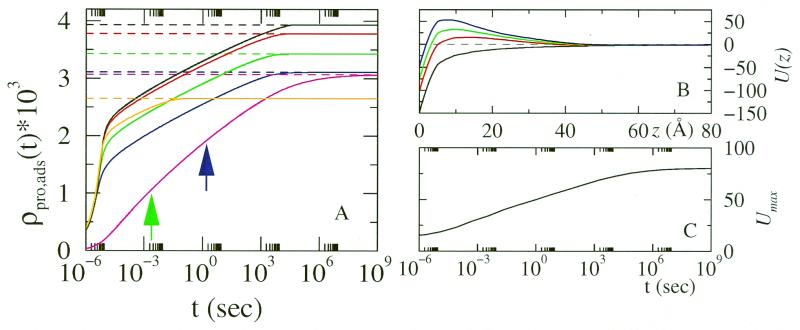
Figure 2.
(A) Amount of proteins adsorbed, in molecules per Å2, as a function of time. The dashed lines correspond to the equilibrium amount of protein adsorbed. The lines correspond to the following number of EO units: black, no polymer; red, n =6; green, n =15; blue, n = 25; and orange and magenta, n = 50. The magenta curve corresponds to a hydrophobic surface. (B) The potential of mean force, in kJ/mol, as a function of the distance from the surface for: black, bare protein–surface interaction; and red, n = 50 before the beginning of the adsorption. The green and blue curves are for n = 50 at the times marked by the arrows in A. (C) Maximal steric repulsion for n = 50 as a function of time. Note the changes in the shape and strength of the potential as the adsorption process takes place. All of the results correspond to a grafted density of σ = 0.0012Å−2. Higher surface coverage of polymer will result in slower kinetics but qualitatively similar behavior.

