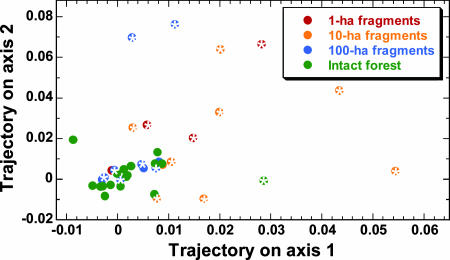
Fig. 4.
Trajectories of change in tree-community composition in fragmented and intact forests in central Amazonia. For both axes, plots within 100 m of forest edges (indicated by a white asterisk within each data point) had significantly larger values than did forest-interior plots (axis 1, P = 0.001; axis 2, P = 0.028; Mann–Whitney U tests). If edge plots were changing randomly, then plot trajectories would be relatively evenly scattered around the control plots rather than being strongly biased toward positive values on both axes.

