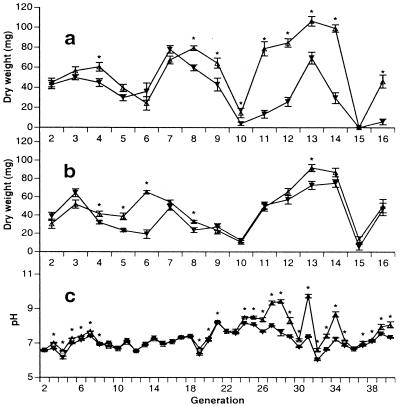
Figure 1.
Results of soil ecosystem and aquatic ecosystem selection experiments. (a) Above-ground biomass of Arabidopsis thaliana plants grown in ecosystems inoculated with 6.0 g of soil. Open, upward-pointing triangles represent mean of 15 microcosms (± 1 SE) selected for high biomass. Solid, downward-pointing triangles represent selection for low biomass. Asterisks indicate generations in which biomass differed significantly (bootstrap test, P < 0.05). There were no significant differences between mean plant biomass in either of the two paired control treatments in the soil ecosystem experiments. (b) The 0.06-g soil inoculum experiment, symbols as described in a. (c) pH of aquatic microcosms selected for high or low pH. Means of 24 aquatic microcosms (± 1 SE), symbols analogous to those given in a.

