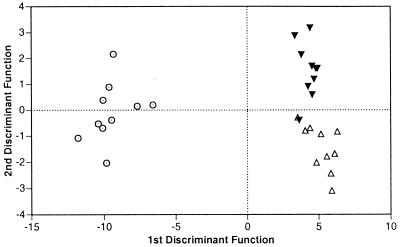
Figure 3.
Discriminant function analysis of 10 soil nutrient variables in the 6.0-g inoculum size treatments, generations 13 and 14 combined. Open, upward-pointing triangles represent soils in microcosms selected for high biomass. Filled, downward-pointing triangles represent selection for low biomass. Circles represent soils from microcosms inoculated with autoclaved slurries and selected at random. The first discriminant function is largely attributable to soil NH4+ content. The second discriminant function is most strongly attributable to soil K, Zn, and P content. (Wilk's λ, 0.00828; F (20, 156) = 77.895; P < 0.0001).

