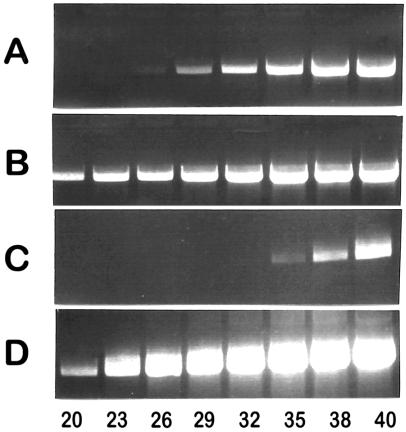
Figure 4.
Quantification of rearrangements in different subpopulations of Rhizobium sp. NGR234. PCR assays were performed for different number of cycles (indicated at the bottom of the lanes). The PCR products were separated by agarose gel electrophoresis and stained with ethidium bromide. DNAs from the wild-type strain and from strains pure for specific rearrangements were used as templates: wild-type strain (A and C); CFNX502 (B); and CFNX503 (D). Different pairs of primers were used. For each pair of primers, the size of the PCR product in kb is indicated in the first set of parentheses and the type of structure detected is indicated in the second set of parentheses: (A and B) NGRnifHDK2 FP and NGRnifHDK1 RP (4.4) (NGRnifHDK1–2 amp); and (C and D) NGRIS5c FP and NGRIS5b RP (3.2) (NGRIS5b-c amp). For quantification, the procedure was standardized as indicated in the text. The relative proportion of cells containing a rearrangement (as indicated in the text) was determined by comparing the number of cycles necessary to synthesize a certain amount of product by using DNA from either the wild type or the subpopulation pure for a specific rearrangement as template.

