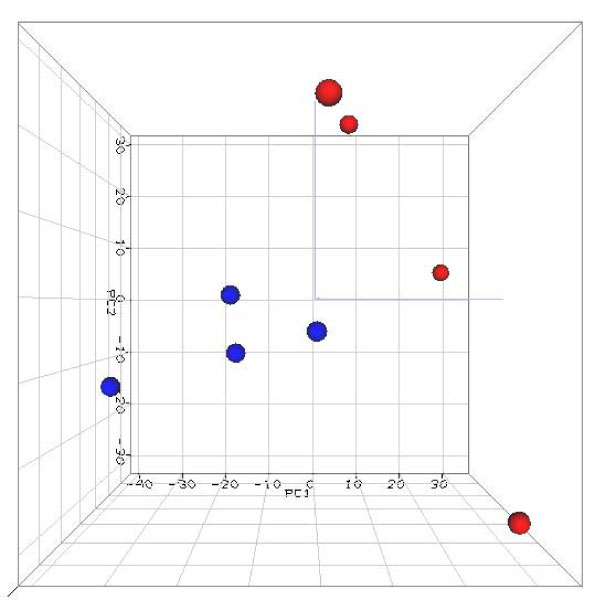
Figure 3.

Principal component analysis (PCA) 3D view for gene expression profiles from 8 large and small colony Tk mutant samples. The PCA is based on log2 ratios and the expression profiles are across all the 20,000 genes in the microarrays. The blue and red dots indicate large and small colony mutants, respectively. The first three principal components are plotted. The captured variances of PC1 (first principal component), PC2 (second principal component) and PC3 (third principal component; the label is not shown) were 25.5%, 17.4%, and 15.5%, respectively.
