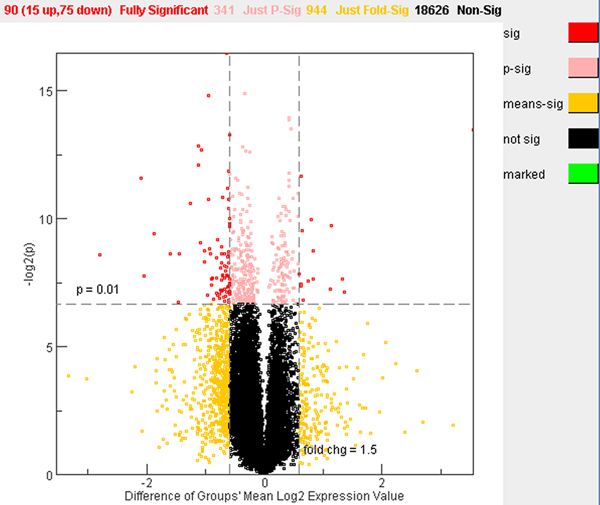
Figure 5.

Volcano plot for differentially expressed genes between large and small colony mutants. The plot is based on log2 ratios and the expression profiles are across all the 20,000 genes in the microarrays. A gene is identified as significantly altered if the p-value is smaller than 0.01 and fold change is greater than 1.5. Red dots indicate significant genes; pink dots indicate genes that have p < 0.01 and fold changes < 1.5; yellow dots indicate genes that have p > 0.01 and fold change > 1.5; and black dots indicate genes that have p > 0.01 and fold change < 1.5.
