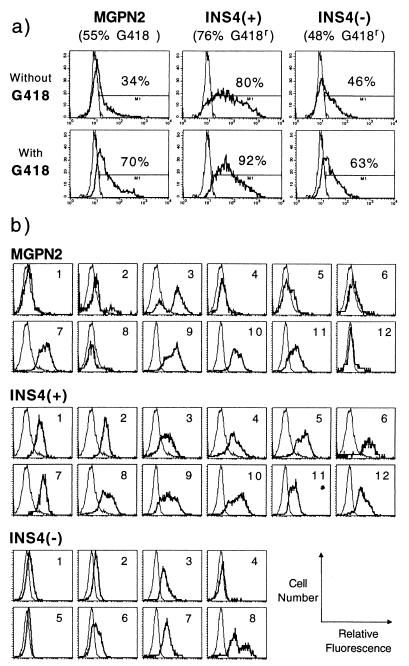
Figure 2.
Expression analysis of transduced mouse bone marrow progenitors. (a) Mouse bone marrow was transduced with the indicated vectors and was plated for myeloid progenitor colony formation in the presence and absence of the neomycin drug analog G418. The percentage of drug-resistant colonies (reported under the vector name) was calculated as follows: (number of colonies grown with G418)/(number of colonies grown without G418) × 100. Pools of colonies were subsequently analyzed for expression of GFP by flow cytometry. The percentage of GFP+ cells is reported above the indicated gates. Data are from one exemplary experiment; see Table 2 for summary of multiple experiments. (b) Flow cytometric analysis of GFP expression in individual colonies grown under G418 selection; each histogram is for a single colony. thick line; experimental samples; thin line, untransduced control. y axis, cell number; x axis, log relative fluorescence.

