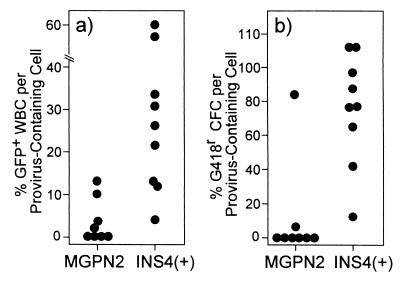
Figure 5.
Normalized vector expression in long-term reconstituted mice. Southern blot analysis similar to that shown in Fig. 3 was performed on spleens collected at 8 months posttransplant, and the copies of provirus per genome were determined (for average copy numbers, see Table 3). The fraction of hematopoietic cells containing at least one copy per cell was then calculated by using the Poisson distribution (assuming the provirus was distributed randomly), and was used to normalize the expression data at the 8-month time point from Fig. 4. (a) Scatter plot showing the fraction of WBC expressing GFP divided by the calculated fraction of cells containing provirus for individual mice. (b) Scatter plot showing the fraction of progenitors [colony-forming cells (CFC)] that were able to form colonies under G418 selection divided by the calculated fraction of cells containing provirus for individual mice.

