
Figure 1.
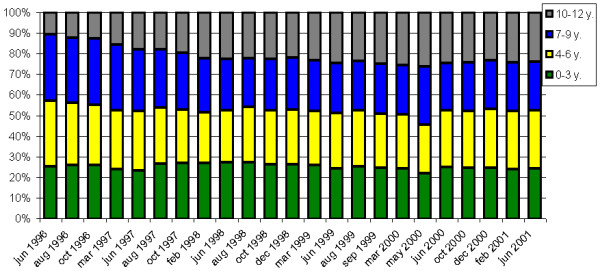
Evolution of the age distribution of the dynamic cohort over time. x-axis: time (date); y-axis: percentage of children for each age group.
Official websites use .gov
A
.gov website belongs to an official
government organization in the United States.
Secure .gov websites use HTTPS
A lock (
) or https:// means you've safely
connected to the .gov website. Share sensitive
information only on official, secure websites.
Evolution of the age distribution of the dynamic cohort over time. x-axis: time (date); y-axis: percentage of children for each age group.