
Figure 4.
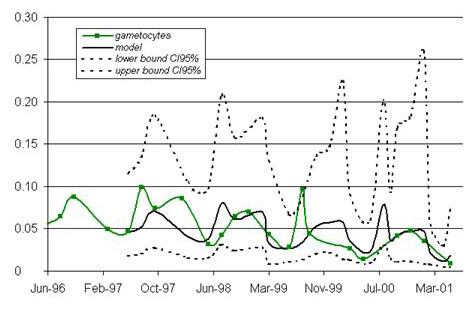
Modeling of changes in P. falciparum gametocyte carriage. The models (including seasonality and a constant decrease in infection incidence from year to year) are presented in bold. The bounds of the 95% confidence interval are indicated as dotted lines. The observed data are shown as a solid line with squares to mark the observation points. x-axis: time (date); y-axis: percentage of newly infected children.