
Figure 6.
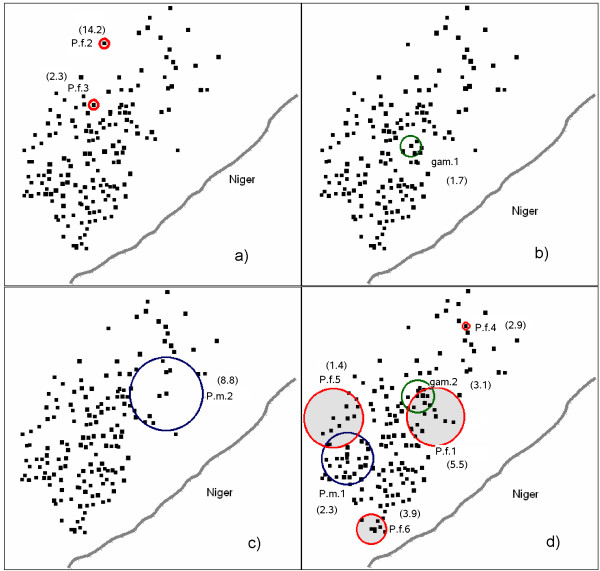
Spatial and temporal locations of infection clusters: (a) October 1996, (b) October 1997, (c) December 1998, (d) May 2000. dots represent the households. Rate Ratio are presented in brackets near each cluster. P.f.: cluster of P. falciparum infections (in red). gam: cluster of P. falciparum gametocyte carriages (in green). P.m.: cluster of P. malariae infections (in blue). The four time frames were selected such that all the clusters were represented. For each of the 4 time frames, the x- and y-axis represent the GPS coordinates.