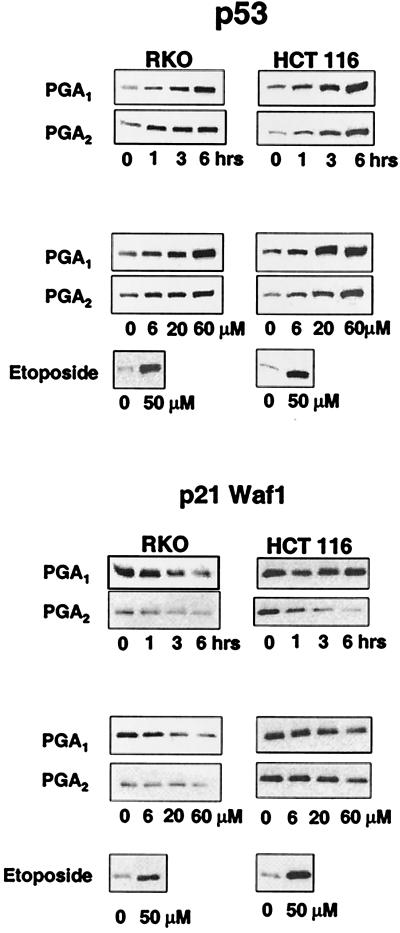
Figure 1.
Inverse relationship between wild-type p53 and p21 expression in RKO and HCT 116 cells treated with electrophilic PG. (Upper) p53 protein expression in RKO and HCT 116 cells incubated with 60 μM PGA1 or PGA2 for 0, 1, 3, and 6 h (lanes labeled as times) or with 0, 6, 20, and 60 μM PGA1 or PGA2 for 6 h (lanes labeled as concentrations). (Lower) p21 protein expression in the same experiment. The sample labeled etoposide in each panel depicts a control response in cells incubated for 6 h with 50 μM etoposide.

